Directory Definition
Before you start writing your services, you need to understand how GoArcc works and the definition of its directory.
Let's dive deep into the definition and codebase.
Directory Structure
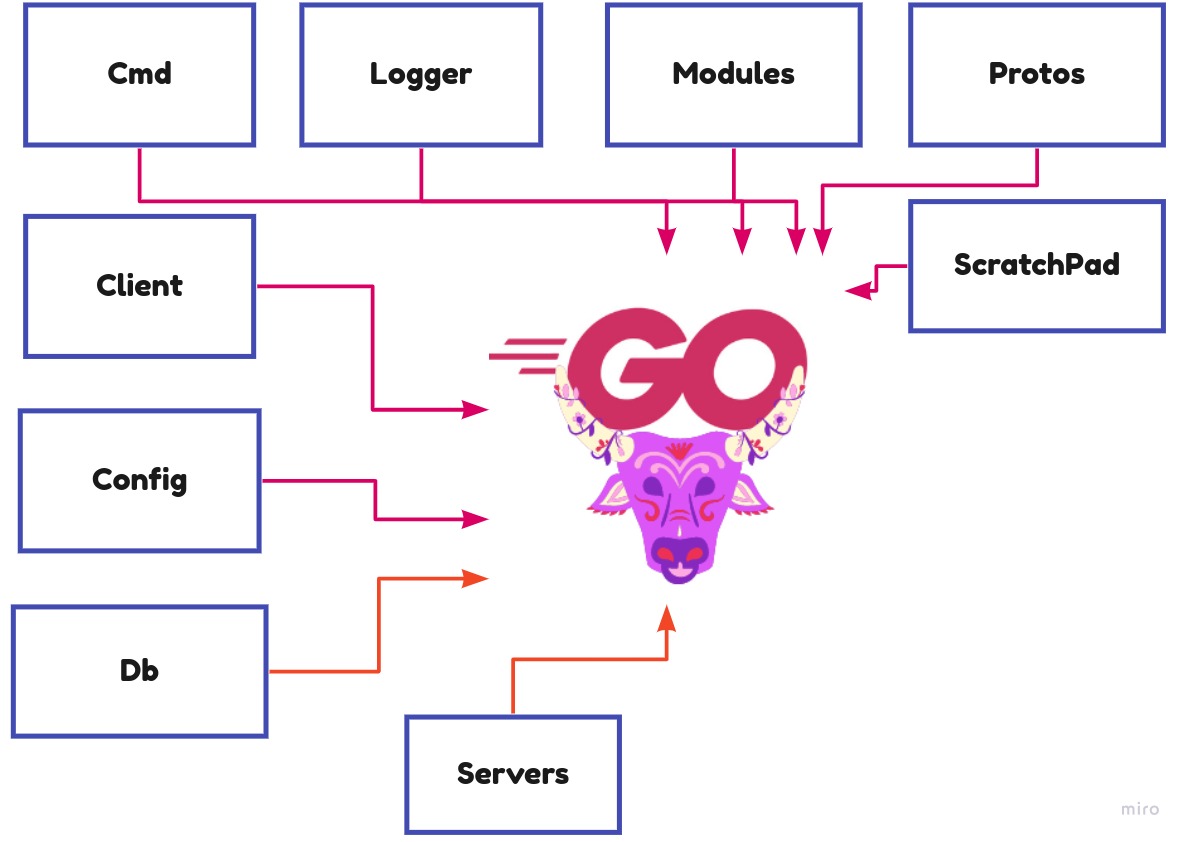
We follow a standard Go directory structure for our codebase so that the developers can easily adapt it. There are multiple directories and multiple libraries inside GoArcc. We will go through each one by one. The diagram below shows multiple directories such as cmd, client, logger, protoc, etc.
Config#
For the GoArcc application to start smoothly, we need some information. As mentioned earlier, we support gRPC, REST, GraphQL. So, we need a different port for all the servers and different settings to start the application. We have a config.yaml file in the root directory. You can change any information from the file like id, password of database, etc according to your use case. See the below example of the config.yaml file.
grpc:  port: 8000  host: localhost  request_timeout: 20
graphql:  port: 8081  host: localhost  request_Timeout: 20
rest:  port: 8082  host: localhost  request_timeout: 20
How can you add a custom config?#
To add some extra configs, you need to make a struct and place it inside the main struct.
type Config struct { Grpc GrpcServerConfig `mapstructure:"GRPC"` Graphql GraphqlServerConfig `mapstructure:"GRAPHQL"` Rest RestServerConfig `mapstructure:"REST"` HealthCheck HealthCheckServerConfig `mapstructure:"HEALTH_CHECK"` Logger LoggerConfig `mapstructure:"LOGGER"` Postgres PostgresConfig `mapstructure:"POSTGRES"` Metrics MetricsConfig `mapstructure:"METRICS"` Jaeger JaegerServerConfig `mapstructure:"JAEGER"` Auth AuthConfig `mapstructure:"AUTH"` GithubVCSConfig VCSSConfig `mapstructure:"GITHUB_VCS_CONFIG"` CadenceConfig CadenceConfig `mapstructure:"CADENCE_CONFIG"`}
Bright Side
If you pass the environment variables then those variables will be overridden to the default variables which is present in the config.yaml file.
How you can pass enviroment variables?#
GRPC_PORT = 8085
Db#
Inside the connection.go file we have a method called NewConnection(). NewConnection is responsible for opening the database connection. Db instance is bound with the fx provider, so we don't need to call this method. See the code below.
func NewConnection(config *config.Config) *gorm.DB {    psqlInfo := fmt.Sprintf("host=%s port=%s user=%s "+        "password=%s dbname=%s sslmode=disable Timezone=Asia/Shanghai",        config.Postgres.Host, config.Postgres.Port, config.Postgres.User, config.Postgres.Password, config.Postgres.DbName)
    // Refrence taken from https://github.com/go-gorm/postgres    db, err := gorm.Open(postgres.New(postgres.Config{        DSN:                  psqlInfo,        PreferSimpleProtocol: true, // disables implicit prepared statement usage    }), &gorm.Config{})
    if err != nil {        logger.Log.Fatal("GORM connection failed", zap.Error(err))        panic(err)    }
    logger.Log.Info("connection established with the database")    //No need to close the connection because we have a single pool of connection.    return db}
In the above code you can change the setting like timezone , ssl mode etc.
Bright Side
We have used GORM as an ORM. If you want to explore GORM then once go through the docs. (https://gorm.io/docs/index.html)
Logger#
As we know, logging is an essential part of the application. It helps in troubleshooting the application and, you can also see the performance of your infrastructure. It provides more visibility to the application at the components level. Logs contain important information so that anyone can debug or find the fault if it exists. We have implemented log in the whole application so that developers don't have to worry about logging. In Golang, we have multiple logging libraries. Here, we will use a zap logger.
Why have we used zap logger? #
Just see the comparison below 😀
Log a message and 10 fields:
| Package | Time | Time % to zap | Objects Allocated |
|---|---|---|---|
| ⚡ zap | 862 ns/op | +0% | 5 allocs/op |
| ⚡ zap (sugared) | 1250 ns/op | +45% | 11 allocs/op |
| zerolog | 4021 ns/op | +366% | 76 allocs/op |
| go-kit | 4542 ns/op | +427% | 105 allocs/op |
| apex/log | 26785 ns/op | +3007% | 115 allocs/op |
| logrus | 29501 ns/op | +3322% | 125 allocs/op |
| log15 | 29906 ns/op | +3369% | 122 allocs/op |
In the main method, there is a method called logger.Init(). This method will create a global logger for your application and takes log level from config.yaml file.
Apart from this, if we need to override the log level, we just set an env variable, or you can change the config.yaml file.
Zap log level reference #
// reference taken from https://github.com/uber-go/zap/blob/120b08c8fae5be92bc7323ca78b25cd790e8c37a/level.go#L28const ( // DebugLevel logs are typically voluminous, and are usually disabled in // production. DebugLevel = zapcore.DebugLevel // InfoLevel is the default logging priority. InfoLevel = zapcore.InfoLevel // WarnLevel logs are more important than Info, but don't need individual // human review. WarnLevel = zapcore.WarnLevel // ErrorLevel logs are high-priority. If an application is running smoothly, // it shouldn't generate any error-level logs. ErrorLevel = zapcore.ErrorLevel // DPanicLevel logs are particularly important errors. In development the // logger panics after writing the message. DPanicLevel = zapcore.DPanicLevel // PanicLevel logs a message, then panics. PanicLevel = zapcore.PanicLevel // FatalLevel logs a message, then calls os.Exit(1). FatalLevel = zapcore.FatalLevel)
Bright Side
Zap logger have different log level. You can read more about zap (https://pkg.go.dev/go.uber.org/zap) You can also see the different log level of zap
Cmd#
As we know, in Golang, we have a convention of cmd folders, and it has its significance. Go through this doc to read about the Go project layout (https://github.com/golang-standards/project-layout). Let’s see our codebase. When we go inside the cmd folder, we see there are multiple files (paste GitHub link here).
- main.go
- invokers.go
- providers.go
- app.go
Bright Side
Before understanding the use of each file first go through dependency management in golang. (https://github.com/uber-go/fx)
main.go#
package main
import (    "go.uber.org/zap"    "goarcc/logger")
func main() {    logger.Init(logger.Config{        LogLevel:    zap.DebugLevel,         Development: false,    })    GetApp().Run()}
As we know, the main.go is the entry point for any go application. Here logger.Init() will take the config object as a parameter and initialize the whole application with debug level. This means that you will be able to see the debug levels of the log only in the standard output.
Tip
If you want to see the info or warn level logs then you need to just pass the Zap loglevel in config object.
invokers.go#
package main
import (    "go.uber.org/fx"    "goarcc/servers/cleanup"    "goarcc/servers/graphql"    "goarcc/servers/grpc"    "goarcc/servers/healthcheck"    "goarcc/servers/rest")

func GetInvokersOptions() fx.Option {    return fx.Invoke(        grpc.RunGRPCServer,        grpc.RegisterGrpcModules,        rest.RunRestServer,        graphql.RunGraphqlServer,        healthcheck.HealthCheckRunner,        cleanup.Cleanup,    )}
Let's understand the above code. Here, we have a method GetInvokersOptions(). This function is responsible for starting multiple servers. We have gRPC, REST, and Graphql servers. Apart from that, we also have a health check server. Cleanup code will be executed when we stop our application. Generally, in cleanup code, we gracefully shut down everything and clear the cache, if any.
Alarm
Inside Invoker, we have multiple methods. The invoker method will execute each method sequentially. So there are multiple dependencies among them and if you change the order of execution you will start getting lots of errors. So, if you have explored the fx library then you can play with invokers and providers.
providers.go#
package main
import (    "go.uber.org/fx"    "goarcc/client/grpcClient"    "goarcc/config"    "goarcc/db"    "goarcc/servers/cleanup"    "goarcc/servers/grpc"    "goarcc/servers/openTracing/tracer/jaeger")
func GetProviderOptions() []fx.Option {    return []fx.Option{        config.ProviderFx,        grpc.InitGrpcBeforeServingFx,        db.DatabaseConnectionFx,        cleanup.CleanupFx,        jaeger.JaegerTracerFx,        grpcClient.ConnectionFx,    }}
Let's understand the above code. Here We have a method GetProvidersOptions(). This function loads all the dependencies which we will need to start the application. There are multiple servers and each server has some dependency or needs some predefined object at runtime.
app.go#
package main
import "go.uber.org/fx"
func GetApp() *fx.App {    opts := make([]fx.Option, 0)    opts = GetProviderOptions()    opts = append(opts, GetInvokersOptions())    return fx.New(        opts...,    )}
Here the GetApp() method will resolve all the dependencies and bind the whole application as an object. So, you can easily start the application in the main file.
Servers #
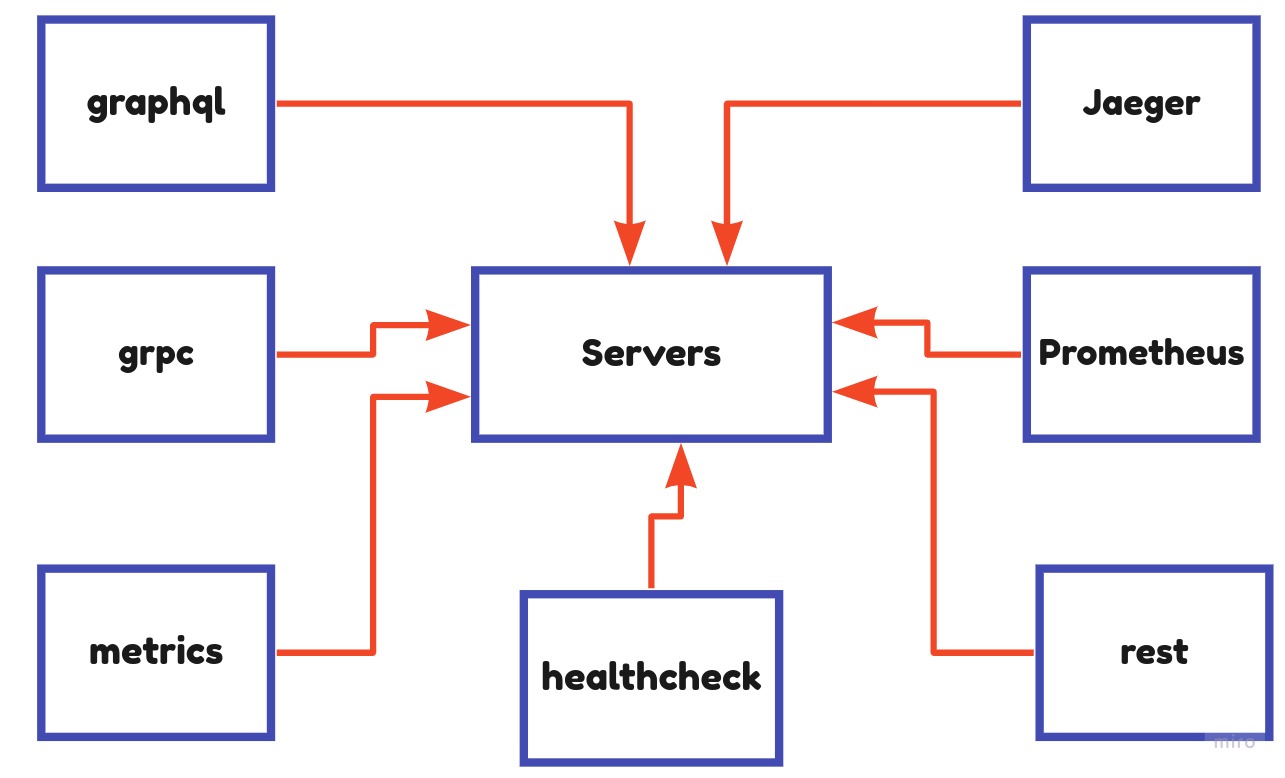
Servers are the core part of this project. As we mentioned, we support multiple servers. Let's dive deep into the codebase.
GRPC#
GoArcc is built upon client-server architecture. So, GRPC is the core server for GoArcc. Every request is handled by the GRPC server and middlewares.
GRPC Middleware#
You have to set up your middleware into gRPC, and it will work for both REST and GraphQL. Auth middleware is already implemented here.
how to register your service client?#
you can register your service as gRPC at servers/grpc/register.go
func RegisterGrpcModules(srv *grpc.Server,    db *gorm.DB,    config *config.Config,    grpcClientConnection *grpc.ClientConn) {
    //register new grpc modules here    // RegisterUserProfilesServer autogenerated in pb/..._grpc.go file    userProfilePb.RegisterUserProfilesServer(srv, userExt.NewUserProfilesServer(db, config, grpcClientConnection))}
REST#
REST APIs over gRPC are achieved by gRPC-gateway. It translates a RESTful HTTP API into gRPC.
how to register your service as REST?#
you can register your service as rest at servers/rest/register.go
func RegisterRESTModules(ctx context.Context, mux *runtime.ServeMux, conn *grpc.ClientConn) error { // Register your REST module here // RegisterUserProfilesHandler autogenerated in pb/..._gw.go if err := userProfilePb.RegisterUserProfilesHandler(ctx, mux, conn); err != nil { logger.Log.Fatal("failed to start HTTP gateway", zap.String("reason", err.Error())) return err } return nil}GraphQL#
We are using grpc-graphql-gateway, this plugin generates GraphQL Schema from Protocol Buffers.
how to register your service as graphQL?#
you can register your service as rest at servers/graphql/register.go
//RegisterGraphqlModules: Mapping the services with the single graphql endpointfunc RegisterGraphqlModules(mux *runtime.ServeMux, conn *grpc.ClientConn) error { // Register your graphql service here if err := userProfilePb.RegisterUserProfilesGraphqlHandler(mux, conn); err != nil { logger.Log.Fatal("failed to start HTTP gateway", zap.String("reason", err.Error())) return err } return nil}HealthCheck#
Any client will be able to check the health of our product. Health information provides a brief idea to the user if the service of their project is down.
HealthCheck runs on http://localhost:8083/health/
Jaeger#
Jaeger is open-source software for tracing transactions between distributed services. It’s used for monitoring and troubleshooting complex microservices environments. Open http://loaclhost:16686 to trace each request easily.
Prometheus#
Prometheus is an open-source system for monitoring and alerting.
Open http://localhost:9090.